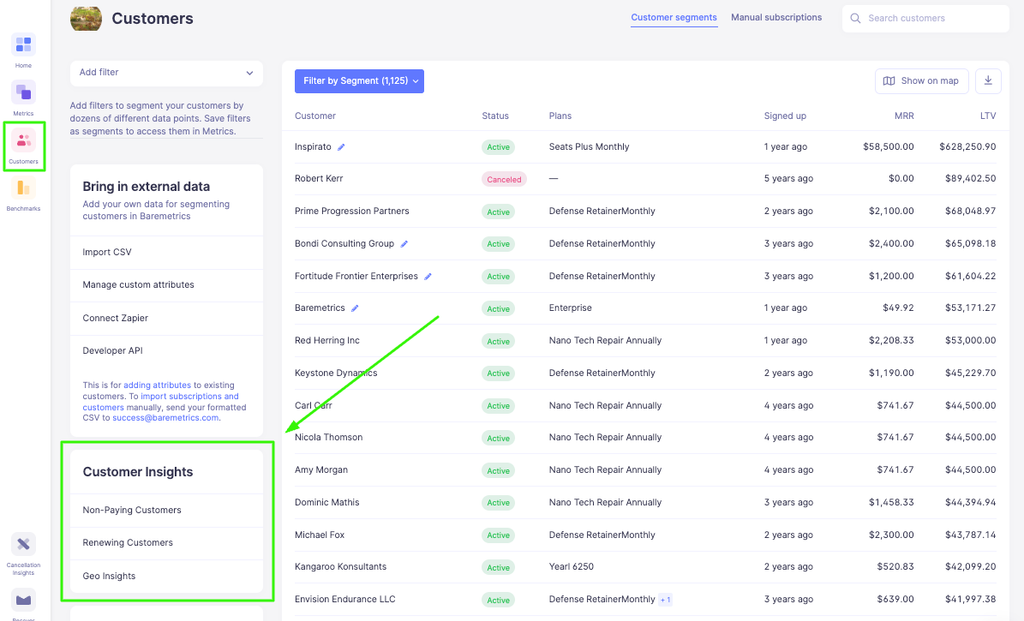
Know exactly who needs your attention, right now. Under Customers → Customer Insights you'll find four lists built to answer the question you're always asking: who's in this situation today?🚫 Non-Paying — Customers with an active subscription who aren't generating revenue. Filter by free plan, 100%-off coupon, or see them all in one view. Great for identifying trial conversion opportunities or cleaning up comp accounts.
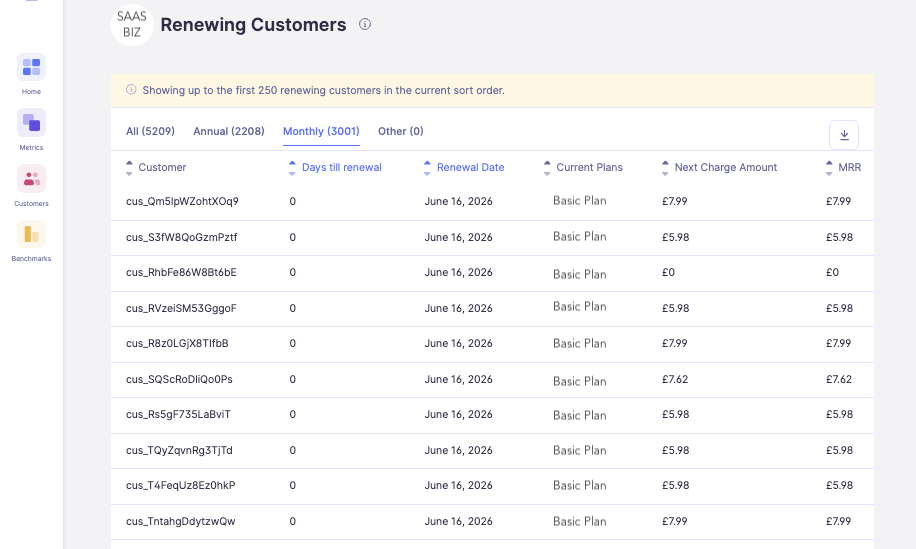
🔄 Renewing — Customers billing again soon. Monthly customers within 7 days, annual within 45. See days until renewal and next charge amount — perfect for proactive outreach before a big renewal hits.
❌ Cancelling — Customers who've already requested cancellation and are scheduled to end within 45 days. Get ahead of it before they're gone. (Requires cancel-at-period-end to be enabled in your Stripe settings.)
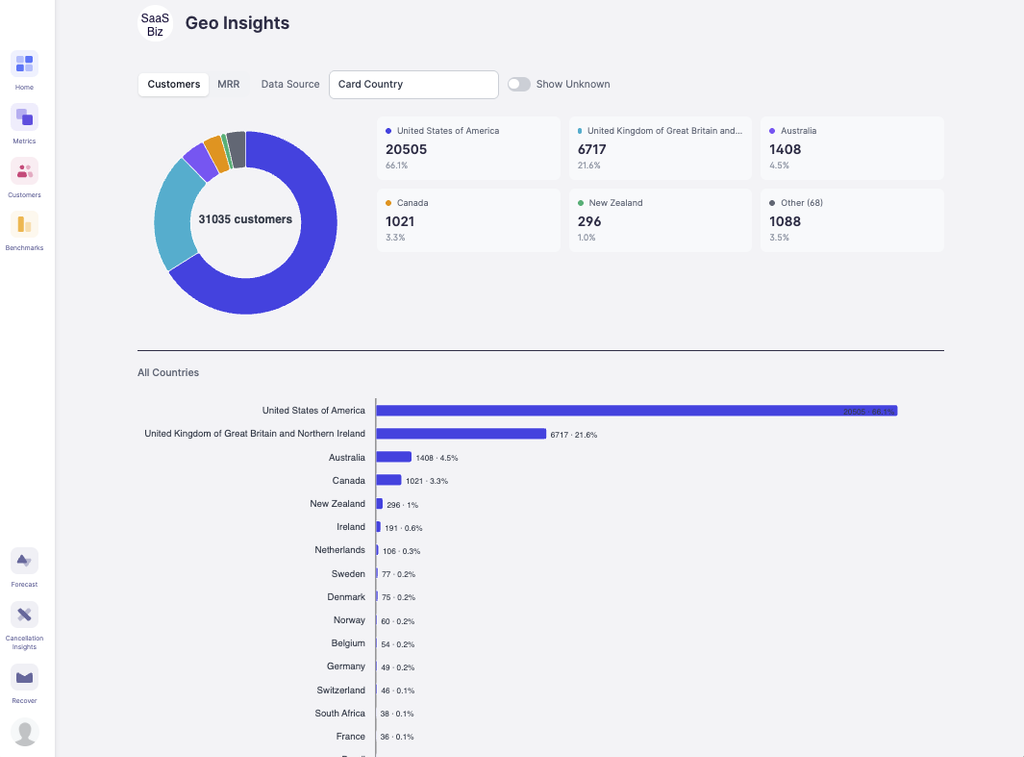
🌍 Geo — A breakdown of your customers by location, viewable by customer count or MRR. Finally know where in the world your revenue is coming from. A few things worth knowing:
Lists refresh once daily, not in real time
Each list shows up to 250 customers — tab counts always reflect true totals
Need the full list? CSV export is available and arrives by email
Integration support varies by list — check the help doc for details
You've been able to share your metrics publicly for a while now — but sharing everything isn't always what you need.
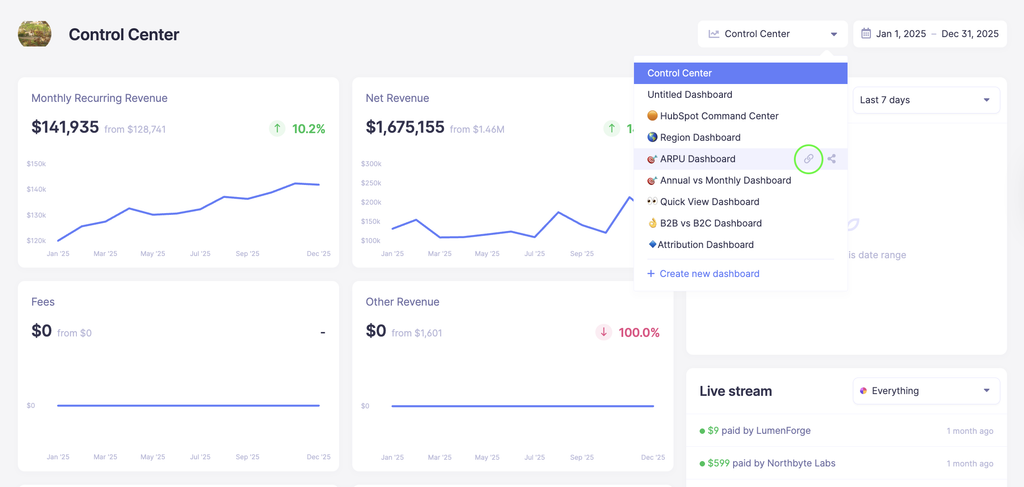
With Custom Dashboards, you can now handpick exactly which metrics and segments you want to share, build them into a dedicated dashboard, and share just that link with whoever needs it — investors, team members, or anyone else, no Baremetrics account required.
External viewers get a clean, focused view with no navigation or dashboard switcher — just the numbers you chose to share. Note that any customer tiles included on the dashboard will be automatically removed from the shared view, so only metrics and numbers data will be visible.
Your MRR should reflect reality, but sometimes it doesn’t.
Maybe a customer was invoiced manually outside of Stripe before the subscription was created. Maybe you extended someone’s trial even though you already consider them a paying customer and want them counted toward MRR. Maybe a subscription temporarily needs to be represented differently for reporting purposes.
Until now, handling these situations usually meant changing data directly in your payment provider or manually recreating the customer in Baremetrics.
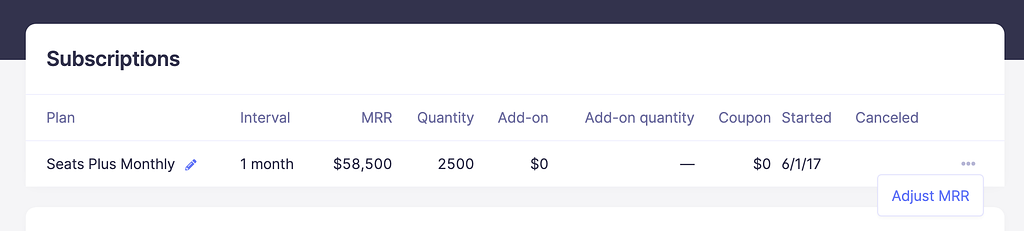
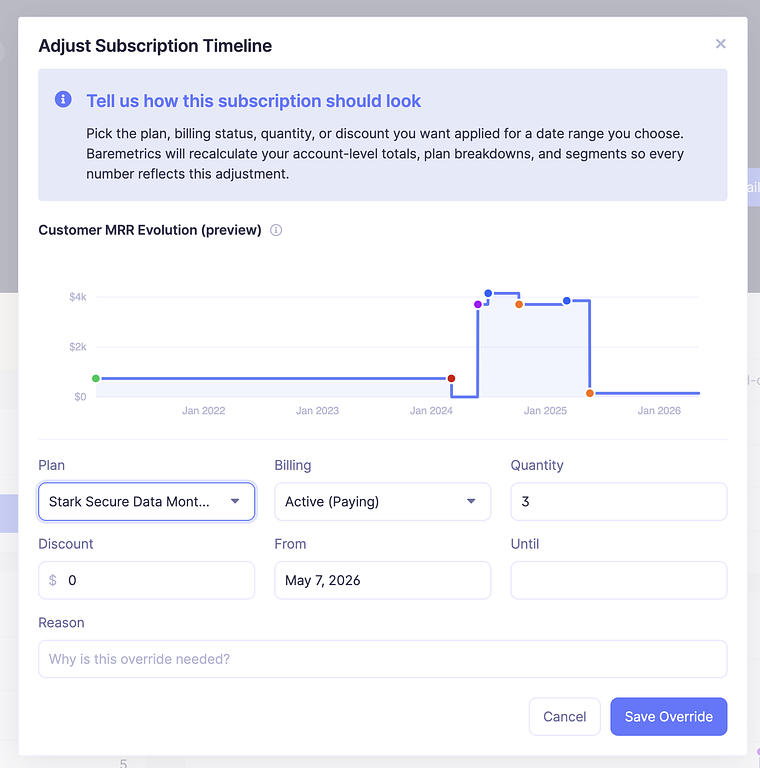
We recently added a new feature called Edit MRR to help handle these edge cases without requiring changes in your payment provider. MRR Adjustments lets you override how a subscription is represented inside Baremetrics for a specific period of time.
From the customer profile, open the subscription, click “Adjust MRR,” and update things like:
Plan
Billing status
Quantity
Discounts
You can apply adjustments to a specific date range, stack multiple adjustments on the same subscription, and remove them at any time. Metrics recalculate immediately when changes are made. Your provider sync will continue working normally and adjustments only exist inside Baremetrics and are never pushed back to your payment provider. This feature is designed for situations where your billing system and your reporting don’t perfectly line up, and you need your metrics to reflect what actually happened.
If you don’t see “Adjust MRR” in your account yet, reach out to support. Your account may still need to be upgraded to the latest version of Baremetrics.
Full details are available in the help doc: [link]
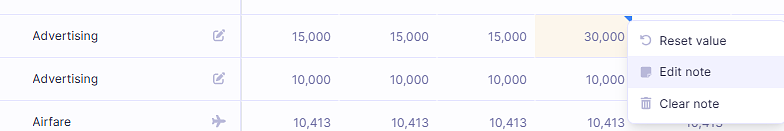
We've made an update to the Forecast+ Operating Model! You can now right-click on any forecast cell to easily reset an overridden value or add a note. If a note exists, you'll see an "Edit note" or "Clear note" option, making it simple to manage your annotations.
Cells with notes will display a small blue triangle in the corner, and hovering over it will show the note's text. This visual indicator helps you quickly identify where notes have been added. 😊
We're excited to introduce some new features to the Cancellation Insights dashboard that make it easier for you to analyze subscription cancellations with precision.
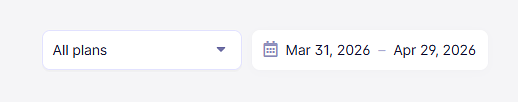
You can now filter cancellations by specific plans, providing you with a more detailed view of your subscription data. When you select a plan, the dashboard will update to reflect relevant data, including cancellation reasons and churn types, tailored to that plan. This means you can now see breakdowns of cancellation reasons by plan. We also made sure that if a plan has no cancellations, the dashboard will show this clearly, avoiding any confusion.
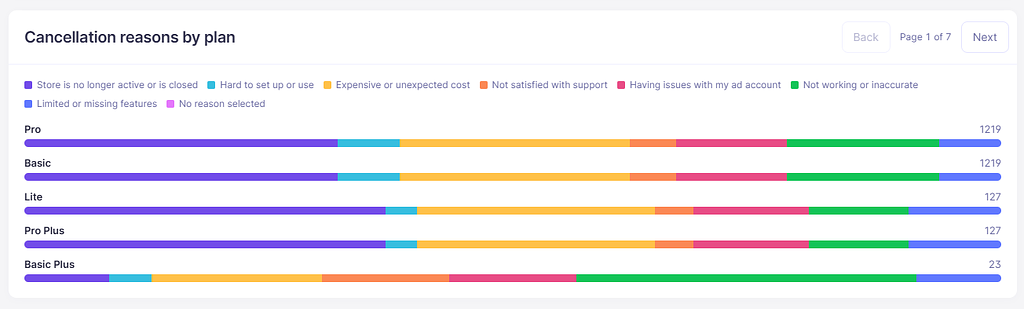
We also added a new tile that quickly shows you cancellation reason by plan for a quick overview:
These updates provide a clearer and easier way to understand your subscription cancellations, helping you make more informed business decisions effortlessly.