New: Cancellation Insights Retention Offers
Keep more customers at the moment they're about to leave.
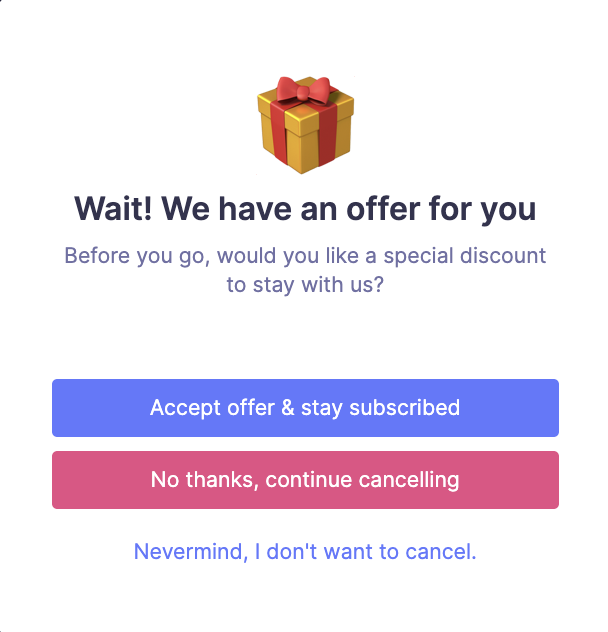
You can now configure retention offers that appear directly in your cancellation widget — so when a customer is on their way out, you have one last chance to change their mind!
When a customer reaches your cancellation flow, they'll see a tailored offer based on their reason for leaving. If they accept, the discount is automatically applied to their Stripe subscription — no manual work required.
To get started, this feature is currently behind a feature flag. Contact us via Intercom or at support@baremetrics.com to have it enabled on your account. Don't have Cancellation Insights yet? Request access to start a free two‑week trial.
Retention Offers are included with Cancellation Insights at no extra cost.
Prerequisites:
- An active Stripe connection in Baremetrics
- The latest version of the Baremetrics Stripe app installed, with permissions accepted — required for coupon creation and subscription updates. Install or update via the Stripe App Marketplace.
What you can configure:
- Offers scoped to specific cancellation reasons
- Custom headline and message text shown in the widget
- Whether repeat customers can see an offer they've previously accepted
A few things to note:
- Discounts created through the configuration page cannot currently be deleted — if you need one removed, contact support and we’ll help.
- If a discount is in use, make sure the corresponding coupon in Stripe is not deleted, as this may cause automatic application to fail.
- More offer types are coming soon, including subscription pauses and trial extensions.
Full setup documentation can be found here.
To enable the feature or start your Cancellation Insights trial, reach out via in-app chat or at support@baremetrics.com.